Output a scalar:
Linear regression:
y = W x + b = ∑ i = 1 n w i x i + b y=Wx+b=\sum\limits_{i=1}^n{w_ix_i}+b y = W x + b = i = 1 ∑ n w i x i + b L = ∑ i = 1 n ( y i − y ^ i ) 2 L=\sum\limits_{i=1}^n(y_i-\hat{y}_i)^2 L = i = 1 ∑ n ( y i − y ^ i ) 2
Polynomial regression:
y = ∑ i = 1 n w i x i + b y=\sum\limits_{i=1}^n{w_ix^i}+b y = i = 1 ∑ n w i x i + b
Logistic regression (output probability):
y = σ ( W x + b ) = 1 1 + e − ∑ i = 1 n w i x i − b y=\sigma(Wx+b)=\frac{1}{1+e^{-\sum\limits_{i=1}^n{w_ix_i}-b}} y = σ ( W x + b ) = 1 + e − i = 1 ∑ n w i x i − b 1 L = − ∑ i = 1 n y i log ( y ^ i ) L=-\sum\limits_{i=1}^n{y_i\log(\hat{y}_i)} L = − i = 1 ∑ n y i log ( y ^ i )
If model can't even fit training data,
then model have large bias (underfitting).
If model can fit training data but not testing data,
then model have large variance (overfitting).
To prevent underfitting, we can:
Add more features as input.
Use more complex and flexible model.
More complex model does not always lead to better performance
on testing data or new data.
Model Training Error Testing Error x x x 31.9 35.0 x 2 x^2 x 2 15.4 18.4 x 3 x^3 x 3 15.3 18.1 x 4 x^4 x 4 14.9 28.2 x 5 x^5 x 5 12.8 232.1
An extreme example,
such function obtains 0 0 0
f ( x ) = { y i , ∃ x i ∈ X random , otherwise \begin{align*}
f(x)=\begin{cases}
y_i, & \exists{x_i}\in{X} \\
\text{random}, & \text{otherwise}
\end{cases}
\end{align*} f ( x ) = { y i , random , ∃ x i ∈ X otherwise To prevent overfitting, we can:
More training data.
Data augmentation: crop, flip, rotate, cutout, mixup.
Constrained model:
Less parameters, sharing parameters.
Less features.
Early stopping.
Dropout.
Regularization.
L1 (Lasso): L ( w ) = ∑ i = 1 n ( y i − y ^ i ) 2 + λ ∑ i = 1 n ∣ w i ∣ L(w)=\sum\limits_{i=1}^n(y_i-\hat{y}_i)^2+\lambda\sum\limits_{i=1}^n|w_i| L ( w ) = i = 1 ∑ n ( y i − y ^ i ) 2 + λ i = 1 ∑ n ∣ w i ∣ L2 (Ridge): L ( w ) = ∑ i = 1 n ( y i − y ^ i ) 2 + λ ∑ i = 1 n w i 2 L(w)=\sum\limits_{i=1}^n(y_i-\hat{y}_i)^2+\lambda\sum\limits_{i=1}^n{w_i^2} L ( w ) = i = 1 ∑ n ( y i − y ^ i ) 2 + λ i = 1 ∑ n w i 2 Elastic Net: L ( w ) = ∑ i = 1 n ( y i − y ^ i ) 2 + λ 1 ∑ i = 1 n ∣ w i ∣ + λ 2 ∑ i = 1 n w i 2 L(w)=\sum\limits_{i=1}^n(y_i-\hat{y}_i)^2+\lambda_1\sum\limits_{i=1}^n|w_i|+\lambda_2\sum\limits_{i=1}^n{w_i^2} L ( w ) = i = 1 ∑ n ( y i − y ^ i ) 2 + λ 1 i = 1 ∑ n ∣ w i ∣ + λ 2 i = 1 ∑ n w i 2 L1 与 L2
w t + 1 = w t − η ∇ L ( w ) = w t − η ( ∂ L ∂ w + λ sign ( w t ) ) ( L1: Sparse Solution ) w t + 1 = w t − η ∇ L ( w ) = ( 1 − η λ ) w t − η ∂ L ∂ w ( L2: Weight Decay ) \begin{split}
w_{t+1}&=w_t-\eta\nabla{L(w)} \\
&=w_t-\eta(\frac{\partial{L}}{\partial{w}}+\lambda\,\text{sign}(w_t))
\quad (\text{L1: Sparse Solution}) \\
w_{t+1}&=w_t-\eta\nabla{L(w)} \\
&=(1-\eta\lambda)w_t-\eta\frac{\partial{L}}{\partial{w}}
\quad (\text{L2: Weight Decay})
\end{split} w t + 1 w t + 1 = w t − η ∇ L ( w ) = w t − η ( ∂ w ∂ L + λ sign ( w t )) ( L1: Sparse Solution ) = w t − η ∇ L ( w ) = ( 1 − η λ ) w t − η ∂ w ∂ L ( L2: Weight Decay ) Spam filtering:
y = δ ( W x + b ) y=\delta(Wx+b) y = δ ( W x + b ) L = ∑ i = 1 n δ ( y i ≠ y ^ i ) L=\sum\limits_{i=1}^n\delta(y_i\ne\hat{y}_i) L = i = 1 ∑ n δ ( y i = y ^ i ) Document classification:
y = softmax ( W x + b ) y=\text{softmax}(Wx+b) y = softmax ( W x + b ) L = − ∑ i = 1 n y i log ( y ^ i ) L=-\sum\limits_{i=1}^n{y_i\log(\hat{y}_i)} L = − i = 1 ∑ n y i log ( y ^ i ) 最大化信息增益 (Information Gain):
a ∗ = arg max a ∈ A Gain ( D , a ) = arg max a ∈ A Ent ( D ) − ∑ v = 1 V ∣ D v ∣ ∣ D ∣ Ent ( D v ) \begin{aligned}
a_* &= \underset{a \in A}{\arg \max} \text{Gain}(D, a) \\
&= \underset{a \in A}{\arg \max} \text{Ent}(D) - \sum\limits_{v=1}^{V}\frac{|{D^v}|}{|{D}|}\text{Ent}(D^v)
\end{aligned} a ∗ = a ∈ A arg max Gain ( D , a ) = a ∈ A arg max Ent ( D ) − v = 1 ∑ V ∣ D ∣ ∣ D v ∣ Ent ( D v ) 其中, 信息熵为 Ent ( D ) = − ∑ k = 1 ∣ Y ∣ p k log 2 p k \text{Ent}(D)=-\sum\limits_{k=1}^{|\mathcal{Y}|}p_k\log_2 p_k Ent ( D ) = − k = 1 ∑ ∣ Y ∣ p k log 2 p k
SVM, 寻找距离正负样本都最远的超平面:
y = sign ( W x + b ) y=\text{sign}(Wx+b) y = sign ( W x + b ) 最靠近决策边界 (超平面) 的样本点称为支持向量:
决定位置: 决定决策边界的方向和位置
高效性: SVM 对输入扰动不敏感, 删掉非支持向量的点, 模型的决策边界不变
最大化间隔: 最大化超平面到支持向量的距离
贝叶斯分类器, 最小化分类错误率:
h ∗ ( x ) = arg min c ∈ Y R ( c ∣ x ) = arg min i ∈ { 1 , 2 , … , N } ∑ j = 1 N λ i j P ( c j ∣ x ) \begin{aligned}
h^*(\boldsymbol{x}) &= \underset{c \in \mathcal{Y}}{\arg \min} R(c | \boldsymbol{x}) \\
&= \underset{i \in \{1, 2, \dots, N\}}{\arg \min} \sum\limits_{j=1}^N\lambda_{ij}P(c_j | \boldsymbol{x})
\end{aligned} h ∗ ( x ) = c ∈ Y arg min R ( c ∣ x ) = i ∈ { 1 , 2 , … , N } arg min j = 1 ∑ N λ ij P ( c j ∣ x ) 朴素贝叶斯分类器, 最大化后验概率:
h nb ( x ) = arg max c ∈ Y P ( c ) ∏ i = 1 d P ( x i ∣ c ) h_\text{nb}(\boldsymbol{x}) = \underset{c \in \mathcal{Y}}{\arg \max} P(c) \prod_{i=1}^{d}P(x_i | c) h nb ( x ) = c ∈ Y arg max P ( c ) i = 1 ∏ d P ( x i ∣ c ) 其中, P ( c ) = ∣ D c ∣ ∣ D ∣ P(c) = \frac{|D_c|}{|D|} P ( c ) = ∣ D ∣ ∣ D c ∣
kNN (近朱者赤) 基于与待测样本最近的 k k k
y = vote ( neighbors ( x ) ) y=\text{vote}(\text{neighbors}(x)) y = vote ( neighbors ( x )) 利用降维增大样本的稠密性,
消解维度灾难 (样本稀疏而特征维数极高),
使得 kNN 起作用.
Image recognition, game playing:
y = softmax ( ReLU ( W x + b ) ) y=\text{softmax}(\text{ReLU}(Wx+b)) y = softmax ( ReLU ( W x + b )) 结合多个个体学习器 (e.g. 决策树, 支持向量机, 神经网络)
完成学习任务的机器学习范式:
基础模型需要满足 好而不同, 具有准确性与差异性.
ϵ = 0.5 \epsilon = 0.5 ϵ = 0.5
方法 训练方式 关注点 数据采样 Boosting串行 (后续修正前期) 降低偏差 (提升精度) 调整样本权重 Bagging并行 (独立训练) 降低方差 (减小过拟合) 自助采样 (有放回) Stacking分层 (组合输出) 提升整体泛化能力 初级模型预测值
串行式集成 , 个体学习器之间存在强依赖关系, 必须串行生成:
每轮迭代根据前一轮表现调整样本权重, 让模型更关注之前 学错 的样本
将弱学习器逐步提升为强学习器
主要作用: 降低偏差, 提升准确率
典型代表: AdaBoost, GBDT, XGBoost, LightGBM
并行式集成 , 个体学习器之间不存在强依赖关系, 可以并行生成:
Bootstrap: 有放回抽样生成多个不同训练集, 分别训练模型
Aggregation: 平均 (回归) 或投票 (分类) 得出最终结果
主要作用: 降低方差, 提高稳定性
典型代表: 随机森林 (Random Forest), 在决策树训练过程中引入随机属性选择
堆叠式集成 , 分层组合策略:
先训练多个不同的初级学习器, 将它们的预测结果作为 新特征 输入次级学习器
能够融合不同算法的优点: e.g. 同时结合决策树, SVM, KNN
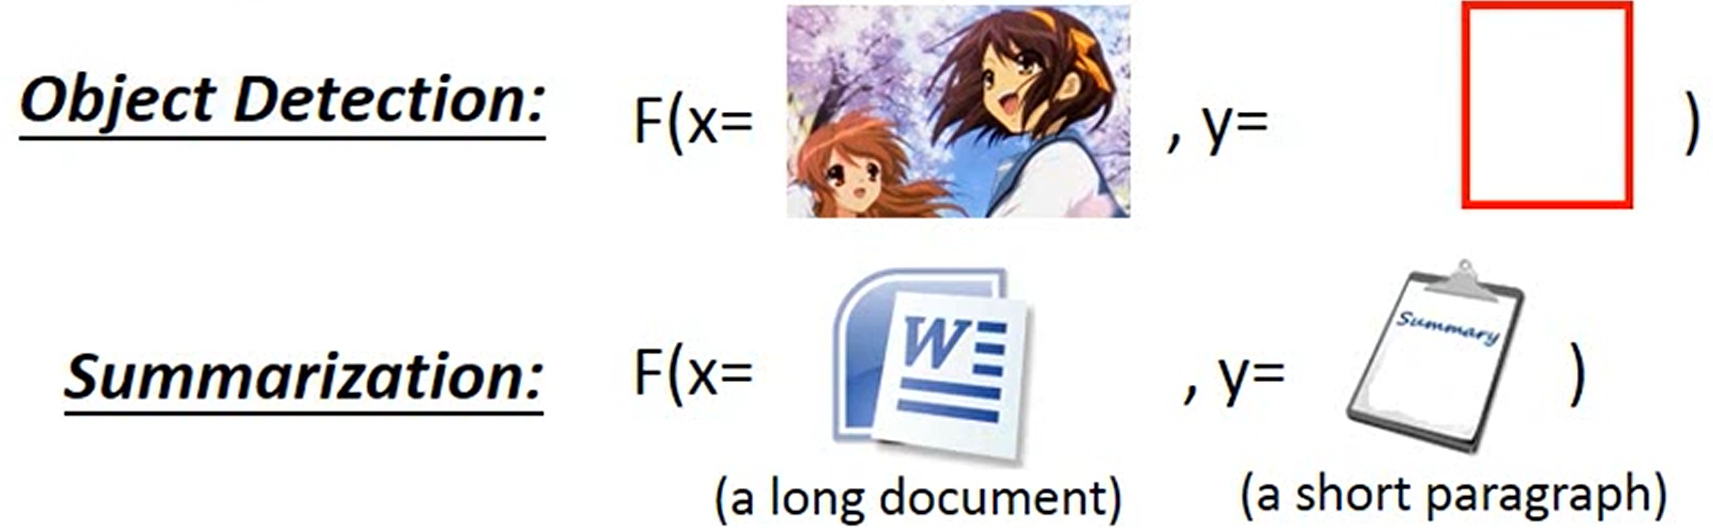
Find a function F F F
F : X × Y → R F:X\times{Y}\to{R} F : X × Y → R F ( x , y ) F(x, y) F ( x , y ) y y y x x x
Given an object x x x
y ~ = arg max y ∈ Y F ( x , y ) \tilde{y}=\arg\max\limits_{y\in{Y}}F(x, y) y ~ = arg y ∈ Y max F ( x , y )
Evaluation: what does F ( X , y ) F(X, y) F ( X , y )
Inference: how to solve arg max \arg\max arg max
Training: how to find F ( x , y ) F(x, y) F ( x , y )
F ( x , y ) = ∑ i = 1 n w i ϕ i ( x , y ) = [ w 1 w 2 w 3 ⋮ w n ] ⋅ [ ϕ 1 ( x , y ) ϕ 2 ( x , y ) ϕ 3 ( x , y ) ⋮ ϕ n ( x , y ) ] = W ⋅ Φ ( x , y ) \begin{split}
F(x, y)&=\sum\limits_{i=1}^n{w_i\phi_i(x, y)} \\
&=\begin{bmatrix}w_1\\w_2\\w_3\\\vdots\\w_n\end{bmatrix}\cdot
\begin{bmatrix}\phi_1(x, y)\\\phi_2(x, y)\\\phi_3(x, y)\\\vdots\\\phi_n(x, y)\end{bmatrix}\\
&=W\cdot\Phi(x, y)
\end{split} F ( x , y ) = i = 1 ∑ n w i ϕ i ( x , y ) = w 1 w 2 w 3 ⋮ w n ⋅ ϕ 1 ( x , y ) ϕ 2 ( x , y ) ϕ 3 ( x , y ) ⋮ ϕ n ( x , y ) = W ⋅ Φ ( x , y )